This article provides an overview of the View Results table in the Advanced View. After reading this article, you'll know how to:
- Use row toolbars to save and delete data
- Understand the History Graph to find product price and sales history
- Evaluate profit potential by looking at key financial figures
- Assess a product's potential by examining the non-financial data
If you prefer a simpler interface, check out our article to Analyze View Results: Basic View.
These Advanced View Results instructions can be used to learn analytical skills for the following search portals:
This article skips over background information covered elsewhere. For those sorts of details, see:
Using The Toolbar
In Advanced View, the toolbar on the left side of each row in the View Results table provides useful tools for managing your data with ease.
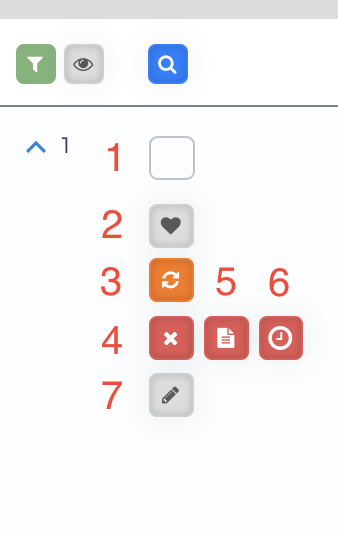
There are 7 tools that you can use to manage your data as picture below.
- Select
- Saved and Move
- Update Data
- Delete Product
- Mark As Mismatch
- Remove and do not show again for some time period
- Product Note/ Add Note
For a complete guide on how to use each tool, check out our View Results Row Toolbar article to learn more.
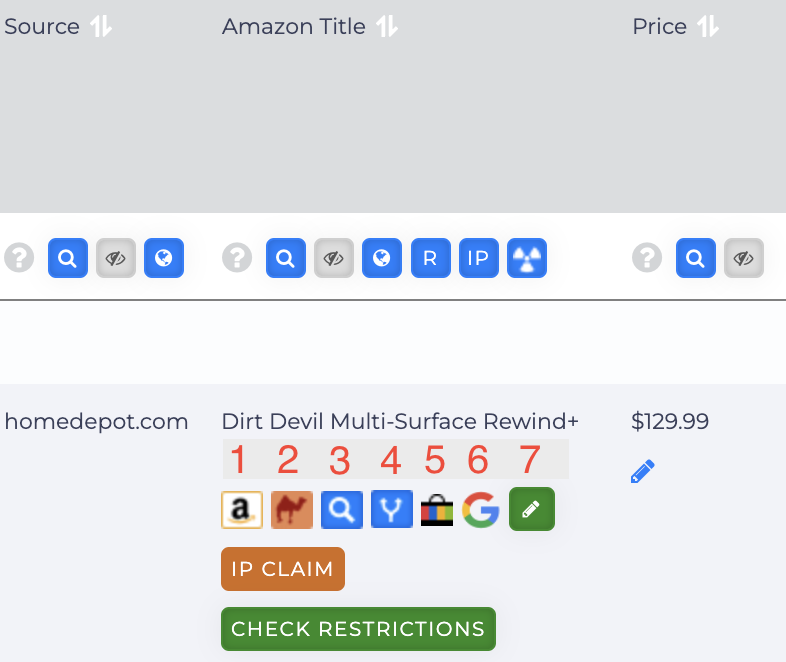
Using the Amazon Toolbar
This toolbar is located within the Amazon Title column. If you don’t see the Amazon Title column, it might be hidden. To display it, click the Manage Column button at the top of the page and toggle on Amazon Title.
You can also manage what you want to see by clicking the number 7 button.
1. Amazon Seller Central
Use this button to confirm you're able to sell this product on Amazon. Occasionally, there are product restrictions. Before making a buy decision, it's a good idea to see if there are any restrictions.
- Open a new tab on your browser and then login to your Amazon Seller Central account.
- Come back to the Tactical Arbitrage tab.
- Click the Amazon Seller Central button. A new Amazon tab displays.
- If Amazon's Add a Product page displays the product name and a Sell Yours button, there are no product restrictions.
2. CamelCamelCamel
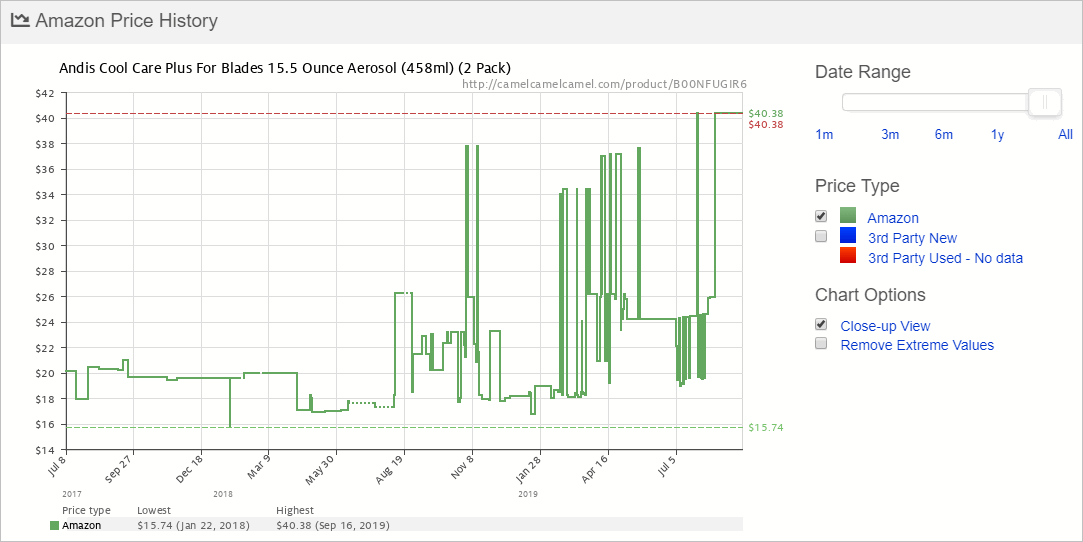
CamelCamelCamel is a free Amazon price tracking tool that helps online shoppers monitor the price history of products on Amazon. It tracks price changes over time and offers visual price history charts, allowing users to see fluctuations and identify the best times to buy.
We integrate this with Tactical Arbitrage so clicking the camel button will open a CamelCamelCamel graph.
Visit their website at camelcamelcamel.com to find out more about CamelCamelCamel.
3. Search Amazon Title
This magnifying glass button is to search for the product title on Amazon. This tool is helpful when there isn’t an exact match for the product. It allows for a quick inspection on Amazon, where you might find a different product that is a perfect match.
4. Source Page and Amazon Page
This button opens the source product page as well as the Amazon product detail page.
5. Checking Completed and Sold on Ebay
This button is to search the Amazon UPC on Ebay for Completed and Sold results.
6. Completed and Sold on Google Shopping
You can check the Amazon UPC on Google page by using this button.
7. Manage Icon/ Adding Custom Link
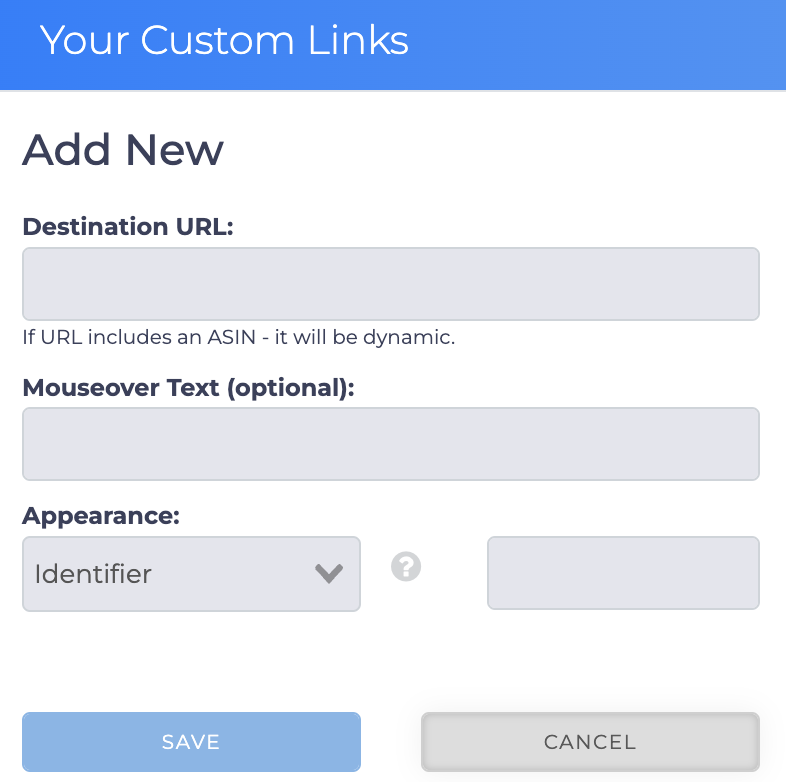
Click this button to open the Your Custom Links popup. You can use this interface to add links to any 3rd party site. The operations are described below.
- Destination URL: Enter the URL you would like to access here. If the URL includes an ASIN, it will be dynamic to the p[roduct on the row you are examining. For example, you could use that feature to link to the Amazon offers page specific to that ASIN.
- Mouseover Text: This optional field can show a litte text you have entered, reminding you of what the new button is for.
- Appearance:
- Identifier: Insert a 1 or 2 letter alpha-numeric identifier here so you can easily identify what the link is for.
- Logo: Upload a JPG or PNG here. Logo should be a minimum of 20 x 20 pixels, less than 2mb.
- Logo URL: Link to your logo, from another URL.
Analyzing Financial Data
The View Results table provides financial estimates for each product. While these figures are essential to your buying decision, it’s also important to consider additional factors like estimated monthly sales, competition, and more.
To make this analysis easier, we recommend placing four columns side by side. This setup organizes key financial data alongside context information in one convenient area.
Group these columns together:
- Gross ROI
- Gross Profit
- Monthly Sales
- Number of Sellers
Before making a buy decision, you should look at non-financial data and consider your own arbitrage strategy. Let’s take a look at two examples below:
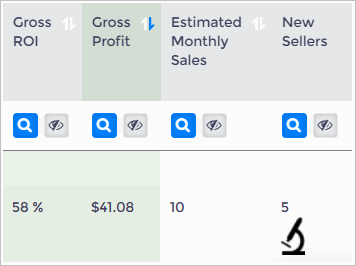
Good Financials Product
Here's an example of a product with good financials and an interesting context.
- The gross profit per sale is $41.08 with a 58% gross ROI.
- The sales context looks moderate. Monthly sales are estimated to be 10 units with 5 sellers.
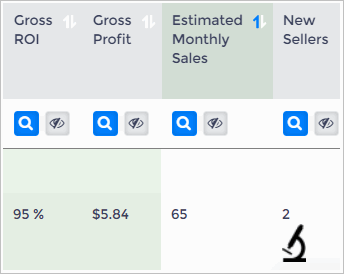
High Volume Product
Here's an example of a high-volume product with a modest profit margin.
- The gross ROI is strong but the gross profit per sales is less than $6.00.
- The context looks strong. There are only two sellers yet the product sells an estimated 65 units per month.
Comparing Non-Financial Data
It's impossible to describe every step you might take to analyze a product and assess its profit potential. There's just too much data to consider. Besides, data analysis is a science and art.
That's why we made a quick checklist. It's four non-financial variables you should consider when making a buy decision.
Some of these steps help you confirm the buy and sell products are identical. Matching products is vital. It helps avoid customer complaints down the road which can result in product returns and bad reviews.
1. Checking Image
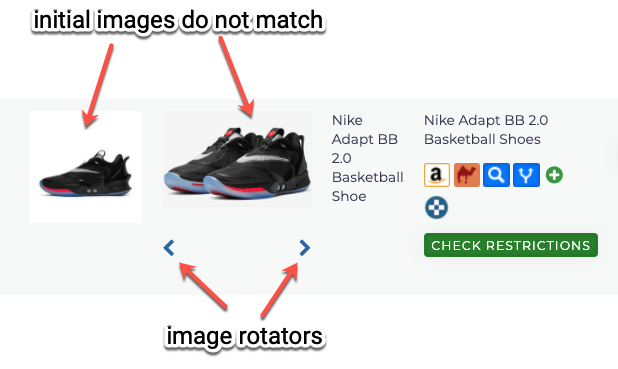
Comparing images is one way to confirm if the source product matches the Amazon product.
If the initial images don’t match, and the Amazon listing has additional images available, two arrows will appear to help you browse through them.
- Click the arrows to change the image display.
- In this example, we clicked the arrows and found a matching image. This is another layer of proof that product quality is the same.
2. Check Quantities
You’ve found a match with a fantastic ROI, but don’t rely on that alone. Be sure to check the quantities as well. Sometimes the title matches, but the quantities don’t align. Here's an example:
The image below shows an appealing gross ROI of 255%. However, the quantities do not match.
- The source product is for one bag.
- The Amazon product is a two-pack. Check the Amazon product by clicking the link. In this case, we see it's the same product but the quantities are different.
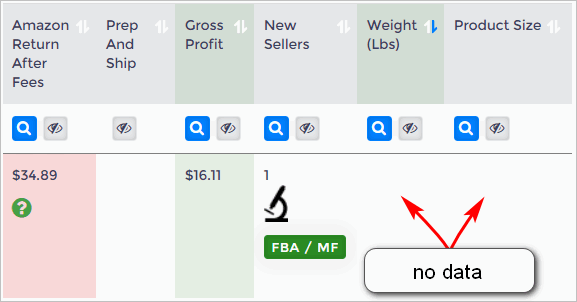
3. Check Weight Data and Size Data
In some cases, Amazon does not provide data for a product's weight and size. This is a significant data gap and should regarded as a red flag. Product weight and size data are needed to accurately calculate Amazon Return After Fees, Gross Profit and Gross ROI.
In some cases (e.g. the gross profit looks too good to pass up) you might spend time investigating a product.
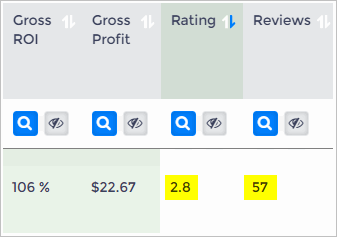
4. Check Product Ratings and Reviews
You can form an opinion about product quality by looking at Amazon customer ratings and the number of customer reviews.
The number of customer reviews gives you an idea about trends. If hundreds or thousands of people award a 4+ start rating, it's likely the product delivers quality to the customer.
Creating a Buy Strategy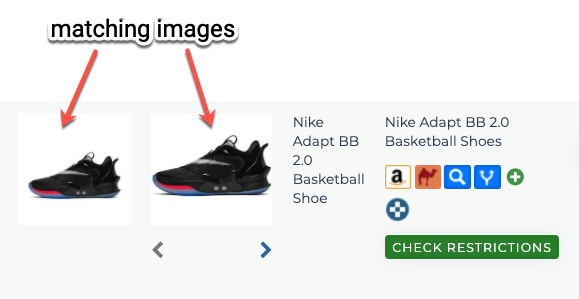
Newcomers to arbitrage may want to make careful buying choices to manage risk effectively.
There are two primary buying strategies: going wide or going deep.
- Going wide involves purchasing a variety of items but only one or two units of each.
- Going deep means buying a large quantity of just a few items. Ideal for products with a high sales rank and significant monthly sales volume.
The best approach depends on factors like your experience level, business goals, available capital, and risk tolerance.
What’s Next?
Stay up to date of the latest stock levels, prices, and fees in your View Results data. For more details, check out our guide on Updating Data in the View Results Page.


