This article will explain the process of using the Product Variations tool. A unique workaround, the tool can be used to identify top-selling items within a group of similar products, providing a competitive edge in inventory decisions.
By the end of this article, you will be able to:
- Locate Product Variations
- Know how to use the Product Variations tool to find top-selling variations.
- Learn to analyze data for smarter inventory decisions.
How Does It Work?
Imagine you’re selling a brand of running shoes. Would purchasing every size and color make sense, hoping all variations sell within the next 12 months? Even without Vulcan’s advanced logic, it’s clear this approach would be inefficient and risky.
Instead, the smart move is to focus your investment capital on variations that are more likely to sell quickly.
But how do you decide which sizes and colors to stock?
That’s where the Product Variations tool comes in! It gives you the critical data you need to make informed decisions and maximize your profits.
Some Backgrounds
Since direct access to Amazon sales data is not possible, an alternative method to identify top-selling variations had to be developed.
After some careful consideration, a breakthrough was achieved: if actual sales data cannot be obtained, an indicator of sales can be created instead.
This led to the decision to count the number of customer reviews for each product variation—a metric readily provided by Amazon. For every verified customer review, the product name and its specific variation (e.g., size and color) are made available.
But what is the connection between the number of reviews and sales? Here’s the reasoning behind it.
- The greater the number of customer reviews, the more the product sells.
- The more a product has sold in the past, the more it will sell in the future.
We know what you're thinking, and yes, there are quite a few assumptions underlying that line of thought. There's no doubt about it.
However, as a general rule and a guiding principle, our experience suggests that the Product Variations tool delivers some amazing data.
That said, let's understand how the tool can be used.
Locating the Search Tool
There are two ways to locate the Product Variations tool:
1. Main Menu
- Go to the main menu on the left side of the screen.
- Click the Analysis Tool tab. A drop-down menu displays.
- Click Product Variations. The panel displays in a new window.
2. View Results Page
- Go to the View Results page and locate the Variations column.
- Click the binoculars. The Product Variations page for that product is displayed in a new window.
Entering Search Data
Before using this tool, you need to select a product and collect the ASIN.
- Locate the product you want to research on Amazon.
- Copy the ASIN.
- Return to Tactical Arbitrage.
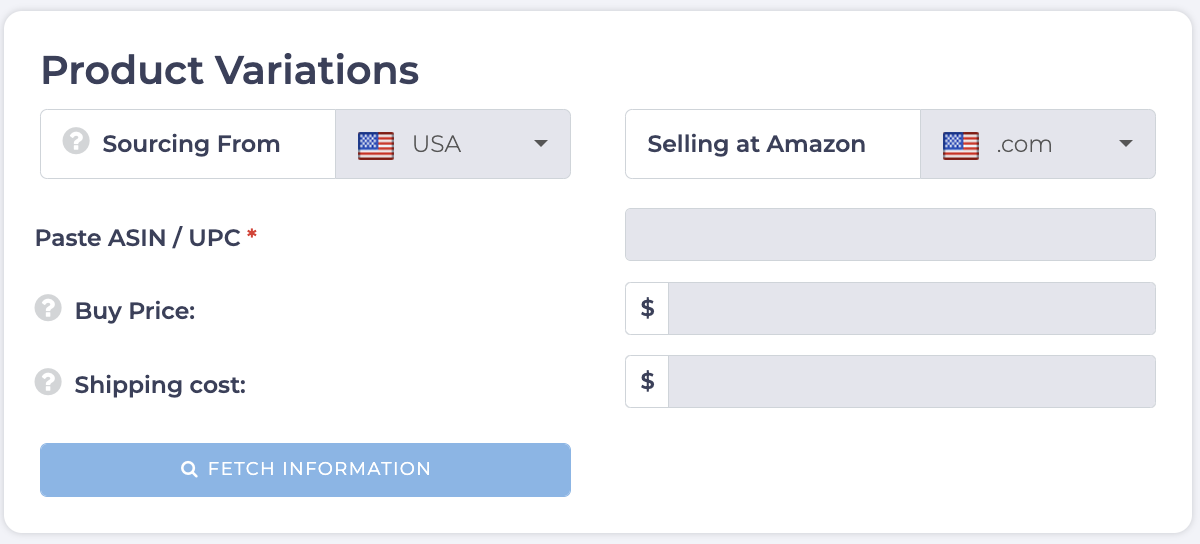
- Paste the ASIN into the Product Variations toolbar.
- Add the buy price and the shipping costs. (not mandatory, but it helps with accurate profit and ROI calculations)
- Click Fetch Information, the Product Variations page displays.
Reading Search Data
The Product Variations page displays three sets of data:
- A box of basic product information at the top of the page.
- A table with rows of products, customer reviews, and profit estimates in the center of the page.
- Summary tables at the bottom of the page.
We're primarily interested in a few columns of data in the center table and the summary tables.
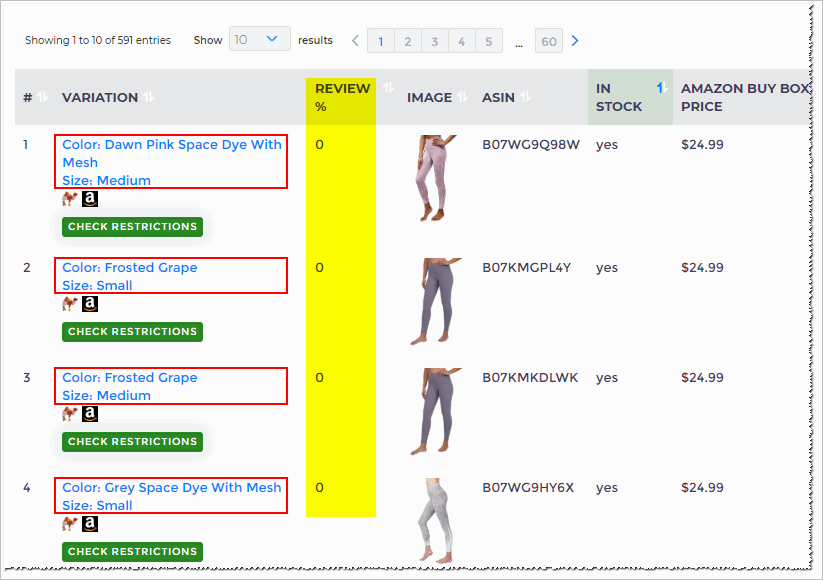
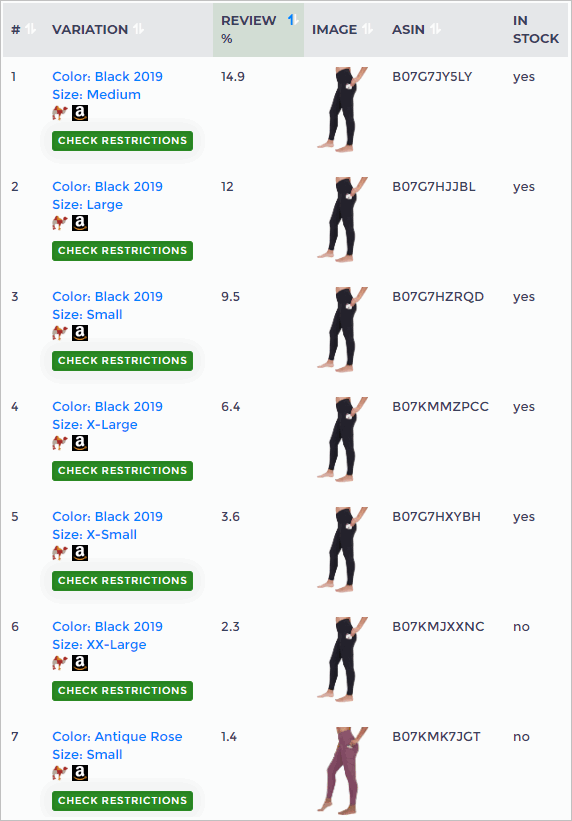
Note: The image below shows several rows of yoga pants. They have different colors and sizes.
Adding Review Percentages
When the Product Variations page first displays, the customer review percentages are all zero. We need to insert those percentages for the analysis.
- Scroll up to the top of the Product Variations page.
- Click the green Analysis button. The Analyze Review panel displays.
- Enter the number of pages of customer reviews you want to search.
- Click Fetch. Tactical Arbitrage searches Amazon results.
How Many Pages to Check?
The Analyze Review panel asks you to select the number of Amazon page results to search.
What's the right number?
It depends. Here are a couple of guidelines.
- If the total number of pages is less than 100, search them all.
- If the total number of pages is more than 100, choose 100.
Sorting Results
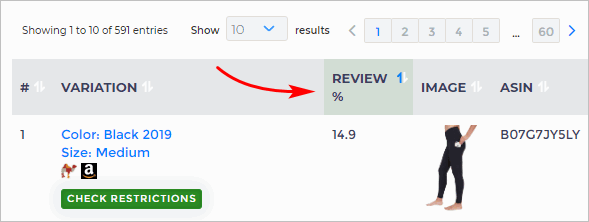
After the Analyze Review completes its work, check the results in the Review % column.
- Click the arrows next to Review %. The list order starts with the largest percentage.
- Be sure the top products (measured by percent of all reviews) are listed first.
Reading the Product Table
The aim here is to find the top product variations.
Let's look at the example of yoga pants.
- The top 3 products account for 36% of all customer reviews.
- By the time you get to the seventh product on the list, the percentage of customer reviews drops below 2%.
- Black is the dominant color.
Reading the Summary Tables
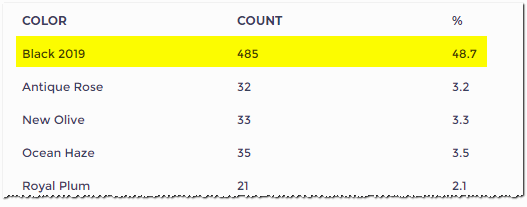
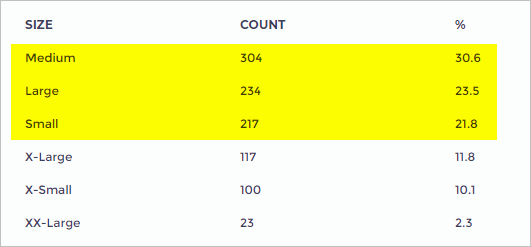
There are two summary tables: Size and Colour.
- Color Summary
The Color shows the number of customer reviews by color. Almost 50% of all reviews are related to black products.
- Size Summary
The Size summary table shows us almost 70% of all customer reviews involve products with 3 standard sizes.
A few ideas about which product variations align with your business goals might already be considered. The next step involves analyzing additional data.
On the Product Variations page, cost data is provided along with a link to Tactical Edge.
Further exploration should be conducted until a clear answer is identified!
What's Next?
Check out our Tactical Edge article to discover how to maximize the power of Tactical Arbitrage’s analysis tools!


