Please Navigate to Profits > Dashboard or click on Profit's Dashboard
The Dashboard displays aggregate data across all your products sold within desired time frame, currency and marketplaces.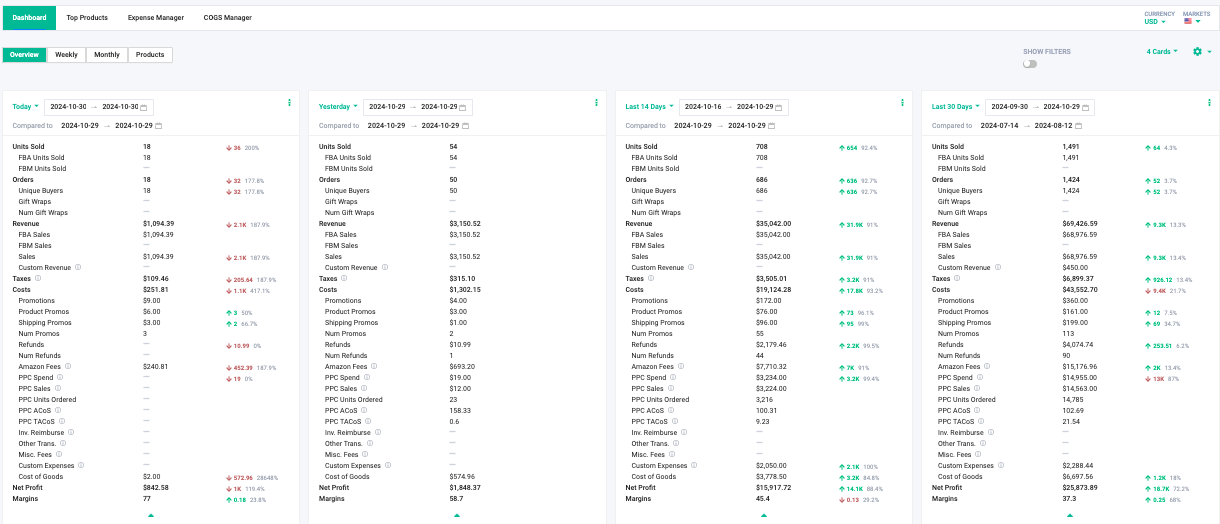
Select to view data for the desired time frame. This will display Units Sold, Orders, Revenue (Sales and Taxes), Costs (Cost Of Goods, Expenses, Amazon Fees, Product Promos, Shipping Promos, Refunds, Advertising (PPC)) and Net Profit (Margins).
Each time card will save as your last selected range even if you leave the page.
There is an icon as seen below which allows you to View Graphs or Download CSV.
If you click on "View Graphs" a pop up will appear with the Profit & Loss Graph.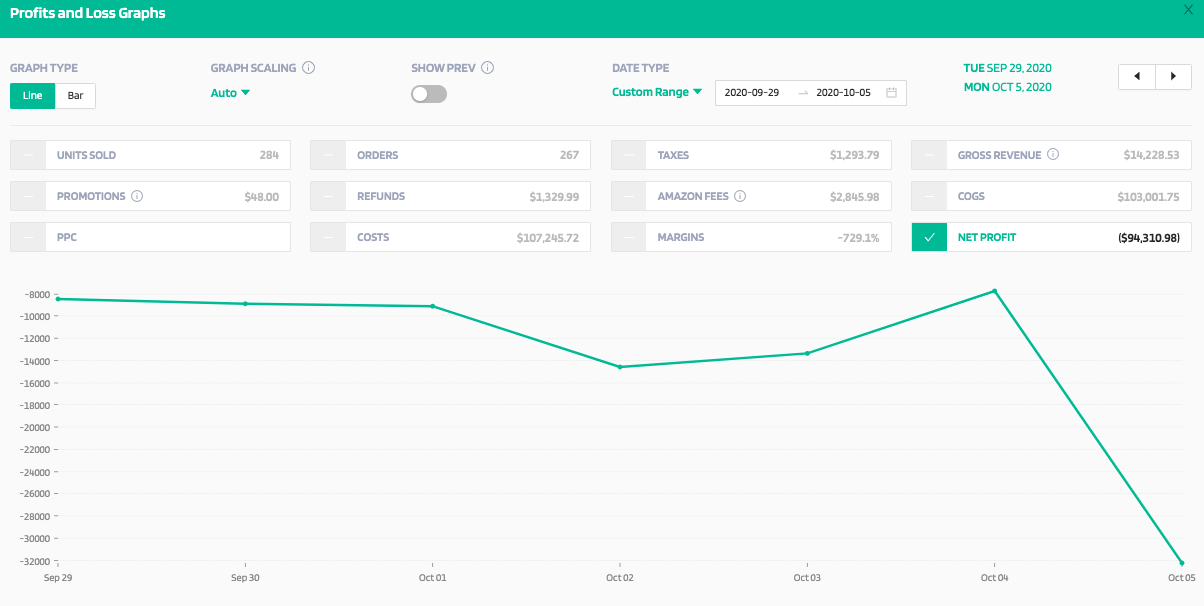
If you click on "Download CSV" a pop up will appear to generate CSV Report for the given date range.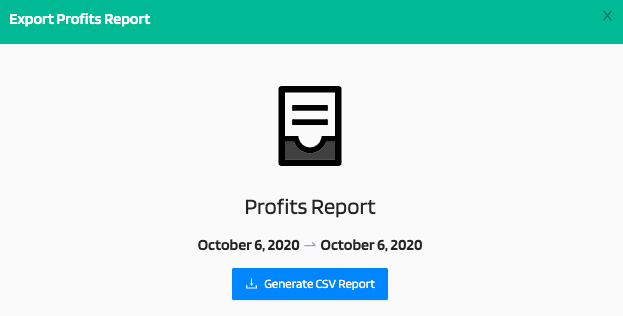
The Quick Overview will display additional aggregate data of various metrics.
Choose your desired date range for the overview data- Custom Range, By Week, By Month, Last 7 Days, Last 14 Days, Last 28 Days, Last 30 Days, Last 60 Days, Last 90 Days, Last 180 Days, Last, 365 Days, MTD, QTD, YTD.
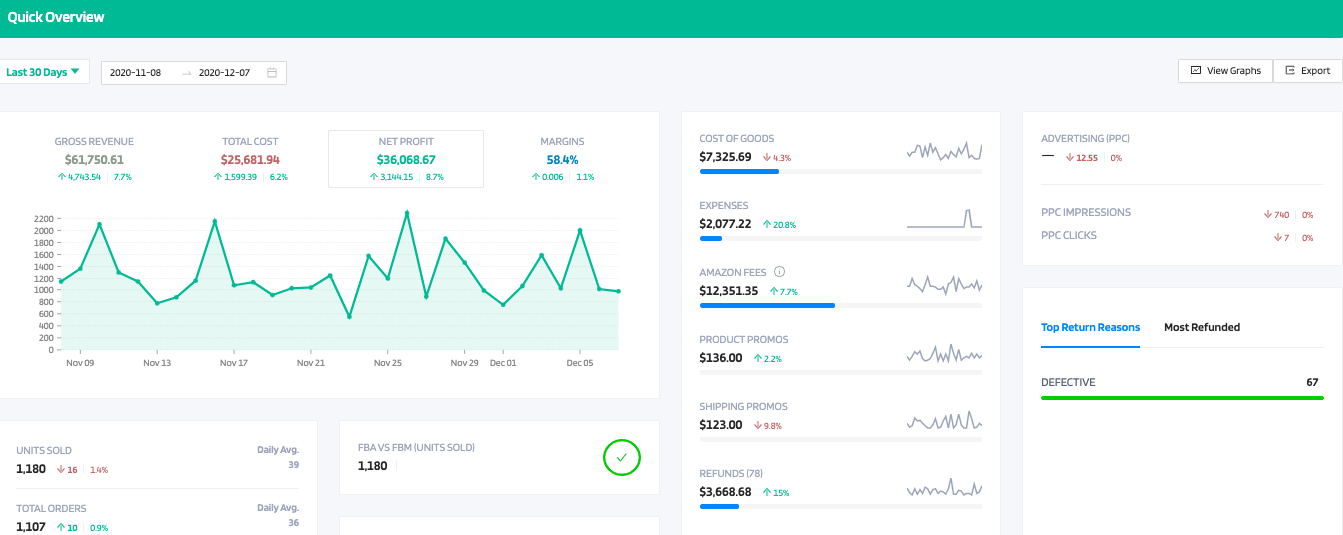

The Quick Overview will provide data for:
-Graph for revenue, costs, and profits by clicking to access each one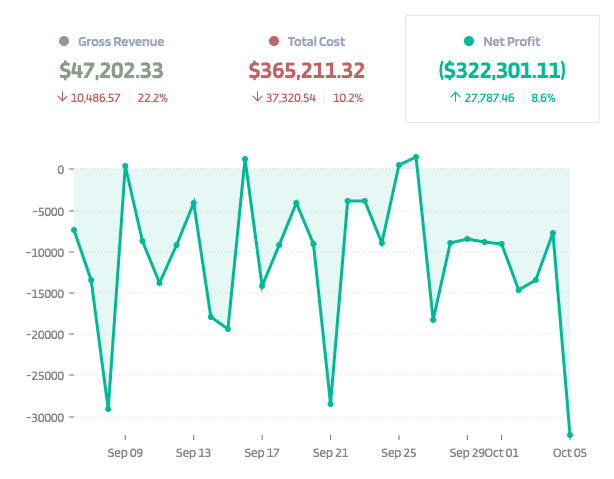
-Units sold
-Total Orders
-Costs: Promos, Refunds, Amazon Fees, Expenses, Cost of Goods, PPC
-Margins
-Promotions: Product Promos and Shipping Promos
-FBA/FBM Orders
-FBA Inventory
-Graph to display Fixed Expenses, Monthly Expenses, and Total Expenses
-Gift Wraps
-Promotions
-Refunds
-Number Reviews
-Unique Buyers
-Amazon Fees Breakdown: Total Fees, Order Fulfillment, Unit Fulfillment, Fba Weight Based, Commission, Fixed Closing, Variable Closing, Sales Tax Collection, Shipping Chargeback, Giftwrap Chargeback, Cod Chargeback, Shipping Holdback, Giftwrap Commission, Refund Commission, Technology, Fba Delivery Services, Amazon Exclusives, Get Paid Faster, Csba
Inside the Quick Overview, you have the ability to View graphs or Export data.
If you click on "View Graphs" a pop up will appear with: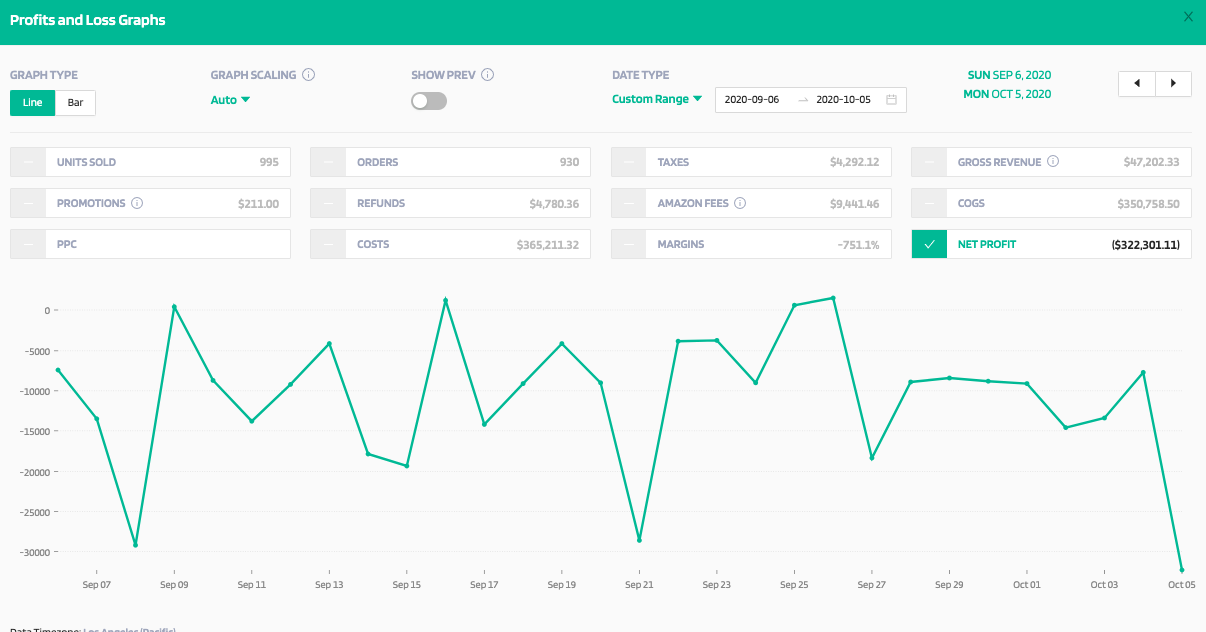
If you click on "Export" a pop up will appear to generate CSV Report.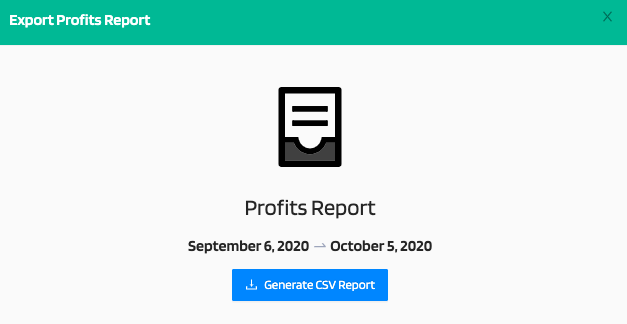
Inside the "By Product Labels" section you have the ability to display the data by labels. Refer to https://support.feedbackwhiz.com/hc/en-us/articles/360058691754-How-to-Group-ASINs-by-labelling-


The Graphs have a drop down which can be changed to display any of the following data: Units Sold, Number Orders, Gross Revenue, Amazon Fees, Advertising PPC, Total Cost, Net Profit.
The Product Labels Section will break down how many products have the label, Units Sold, Number Orders, Gross Revenue, Amazon Fees, Advertising PPC, Total Cost, Net Profit.
Here is the Weekly overview tab: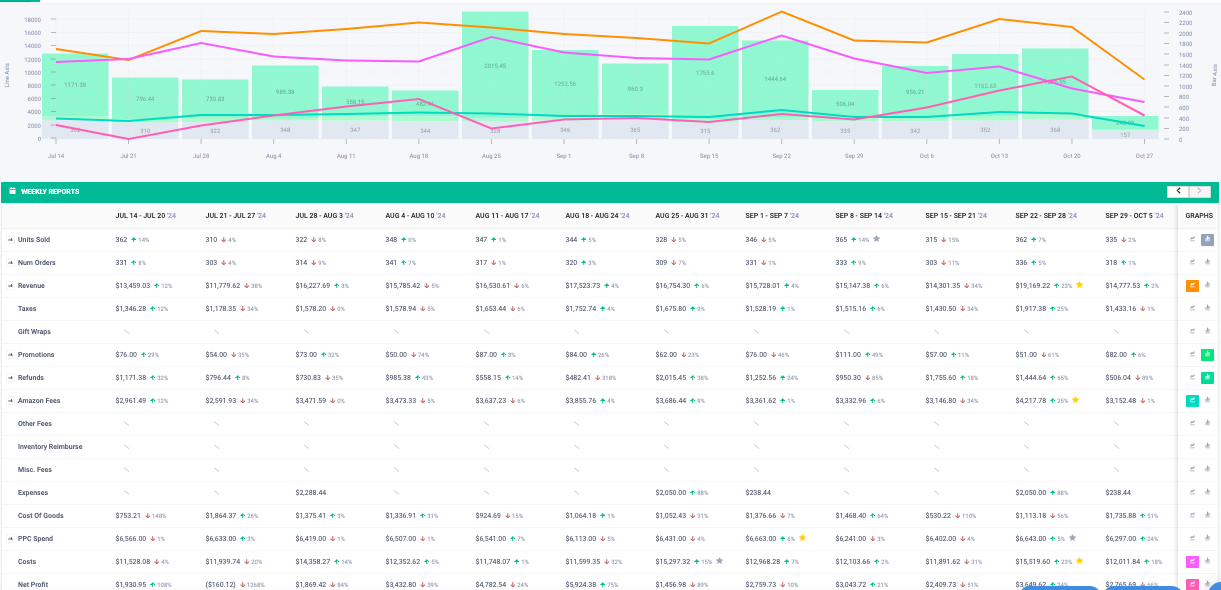
Here is the monthly overview tab: 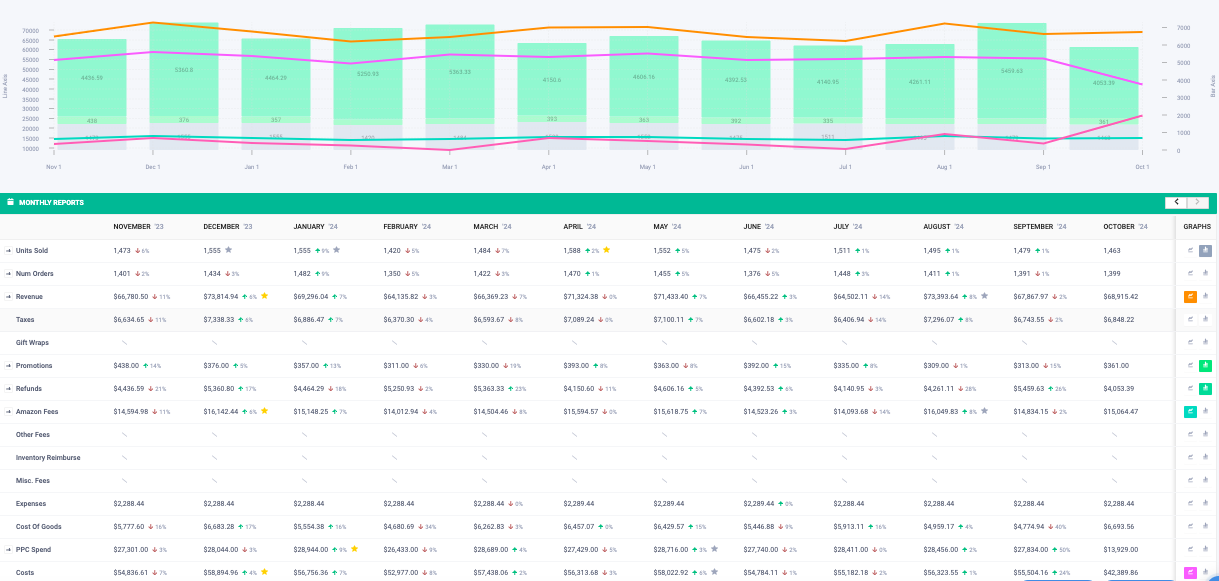
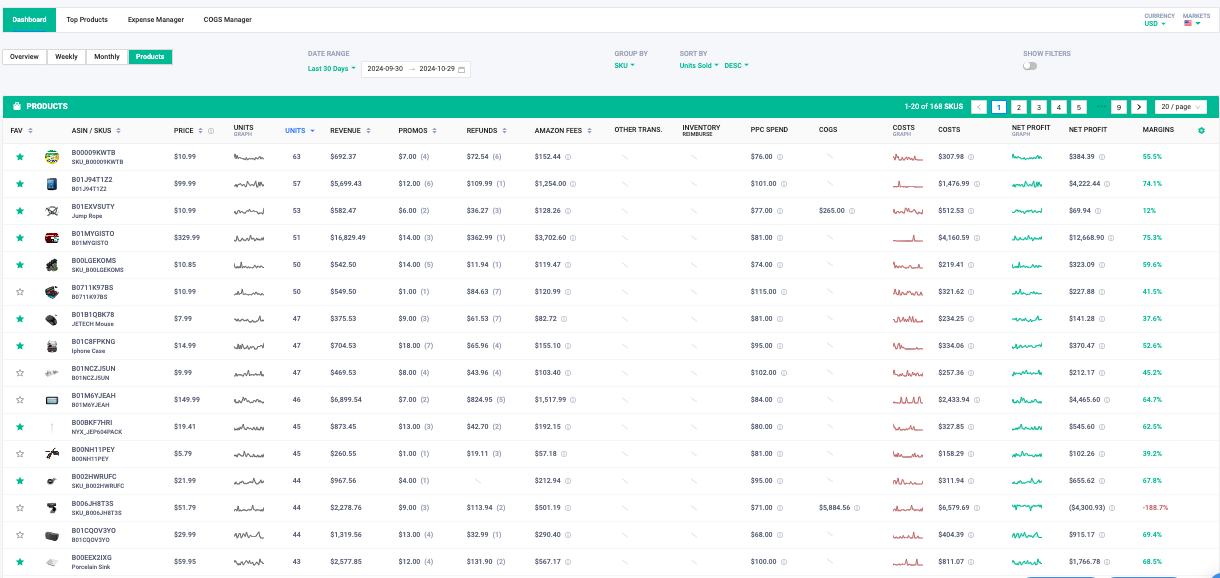
All of this information is also broken down by the ASIN level