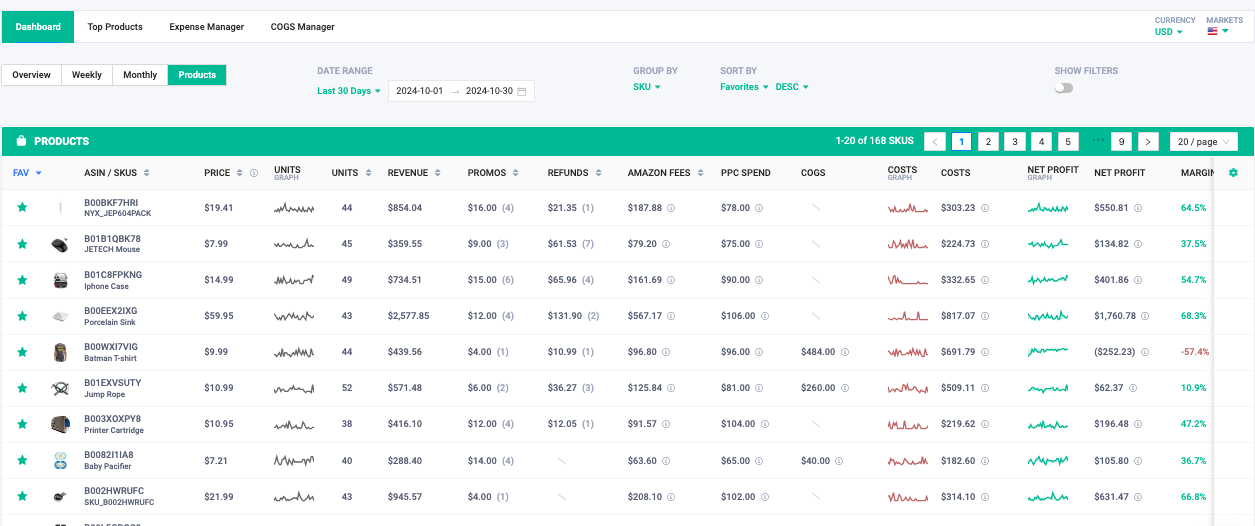
You can view, analyze, and manage all of your Profit's data at the ASIN/SKU level inside the "Products" tab under the Profit's Dashboard.

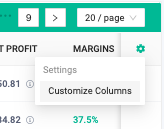
You have the ability to Customize Columns that are displayed by clicking the settings icon on the right corner as pictured below:
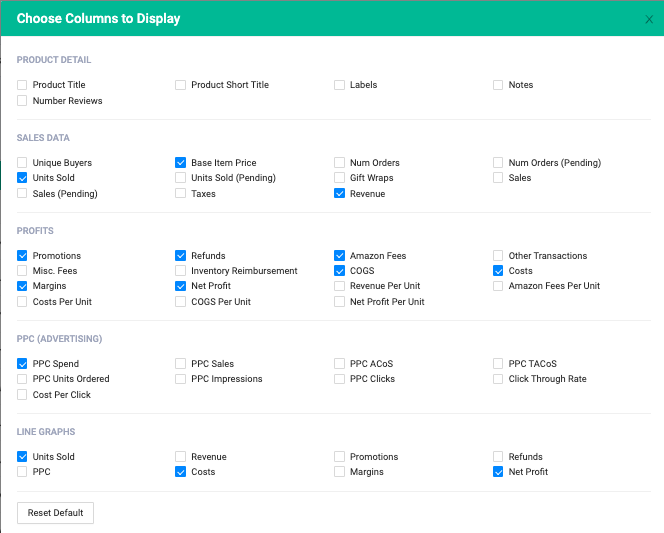
You can choose the following columns to display such as product details, sales data, profit, PPC and graphs.
The Product Manager will break down in detail for the ASIN/SKU level.
You can customize which columns are displayed as seen above. 
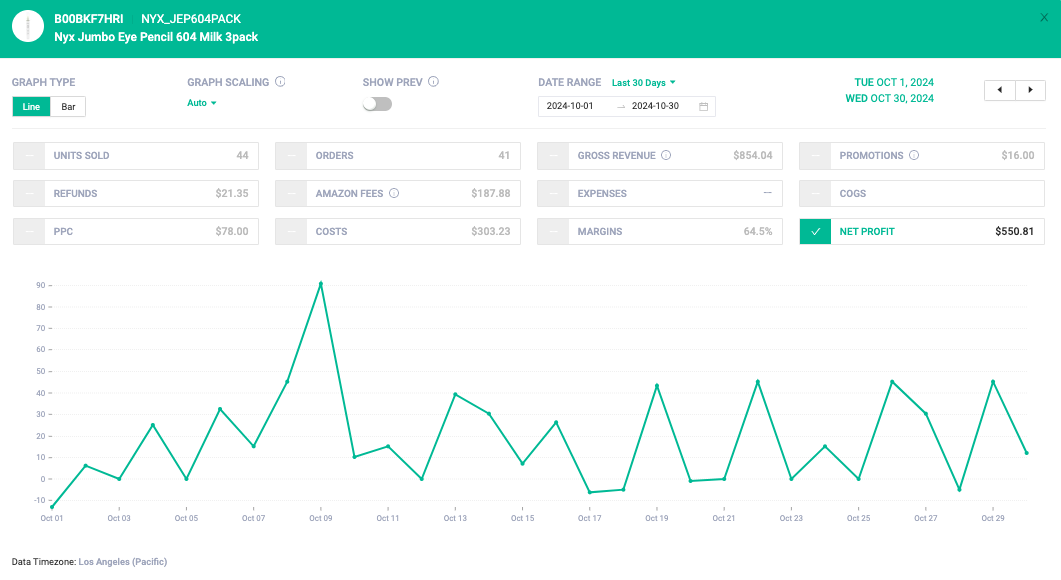
You can click on any graph and a pop up will appear with the "Products Overview" 
Graph type: Line or Bar.
Graph Scaling: Auto, Linear, Percentage, Max Value.
Date Type: Custom Range, By week, By Month, Last 7 days, Last 14 days, Last 28 days, Last 30 days, Last 60 days, Last 90 days, Last 180 days, Last 365 days, MTD, QTD.
Show Prev: Compare currently selected lines with date range selected.


