Graphs

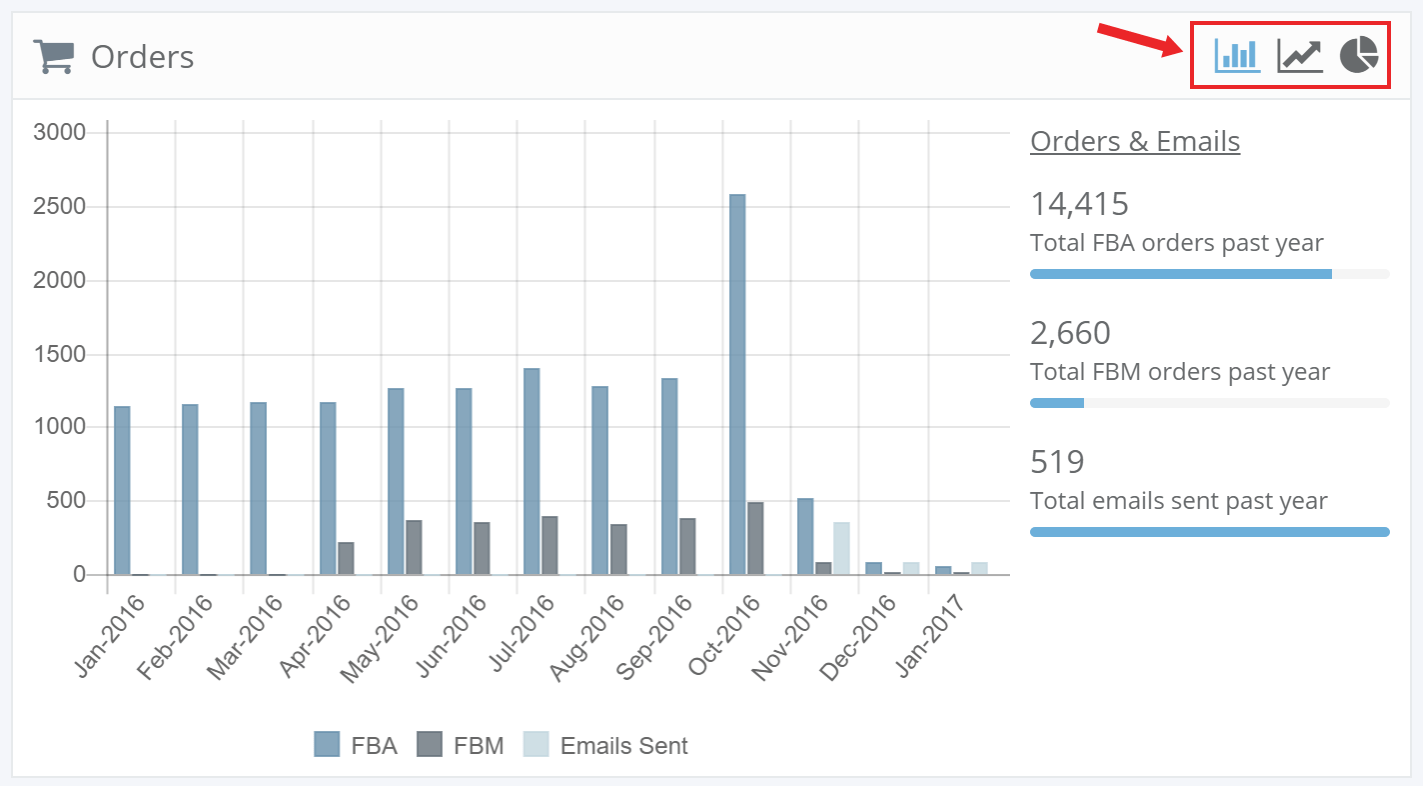
Orders, Sales, Feedback and Product Review graphs are automatically generated based on the time frame selected. There are 3 different types of graphs you can view: Bar, Line, and Pie.
1) To toggle between the different graphs, click the graph icon on the top right hand corner.
Charts

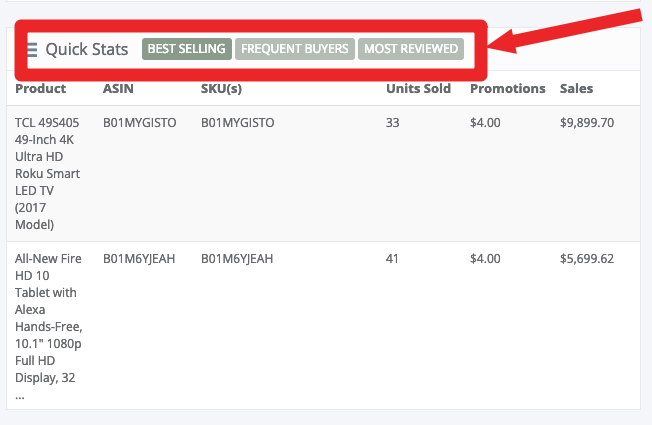
There are 3 types of chart data you can view: Click on the name to toggle between them. The data displayed is based on the time frame selected from the top time frame bar in dashboard.
1) Best Selling
Displays your highest grossing sold products
2) Frequent Buyers
Displays the top repeat buyers
3) Most Reviewed
Displays which products have the most reviews.


